Explain the types of price elasticity of supply.
Explain the types of price elasticity of supply.
(पूर्तिलोचका प्रकारहरु व्याख्या गर्नुहोस् ।)
Question from
Tribhuvan University MGT 207 · Microeconomics for Business 1 paper
Solution
The law of supply tells us only the direction of change: when price rises, supply rises. It does not tell us how much supply changes. That degree of change is measured by the price elasticity of supply (Es), the ratio of the percentage change in quantity supplied to the percentage change in price:
Es = Percentage change in quantity supplied ÷ Percentage change in price = (ΔQ / ΔP) × (P / Q)
Because price and supply move together, Es is positive. The five types can be compared on a single diagram, where all five supply curves pass through the same point A:
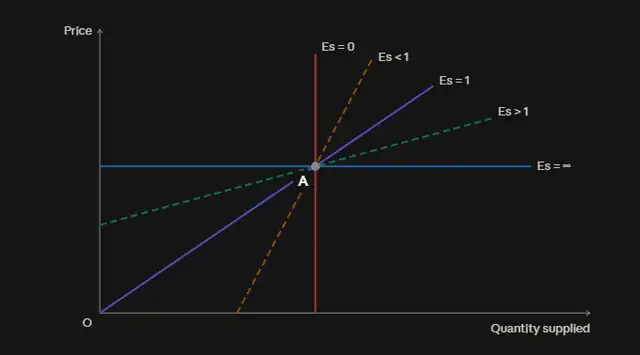
- Perfectly elastic supply (Es = ∞): at a given price, producers are willing to supply an unlimited quantity, but at even a slightly lower price they supply nothing. On the diagram it is the horizontal line through A.
Schedule: at Rs. 100, supply is 100, 500 or 1,000 units, any amount; below Rs. 100, supply is zero.
This is mostly a theoretical case, close to a perfectly competitive firm in the long run. - Relatively elastic supply (Es > 1): a given change in price causes a more than proportionate change in supply. The curve is flatter and starts from the price axis.
Schedule: price 100 → 110 (+10%), supply 100 → 125 (+25%), so Es = 25 ÷ 10 = 2.5.
Examples are plastic goods, garments and noodles, whose output can be raised quickly with spare capacity. - Unitary elastic supply (Es = 1): supply changes in exactly the same proportion as price. The curve is a straight line through the origin O.
Schedule: price 100 → 110 (+10%), supply 100 → 110 (+10%), so Es = 1.
This is a borderline case between elastic and inelastic supply. - Relatively inelastic supply (Es < 1): a given change in price causes a less than proportionate change in supply. The curve is steeper and starts from the quantity axis.
Schedule: price 100 → 110 (+10%), supply 100 → 104 (+4%), so Es = 0.4.
Examples are tea from Ilam gardens or oranges from Dhankuta in the same season, because new plants take years to bear fruit. - Perfectly inelastic supply (Es = 0): supply does not change at all, whatever the price. On the diagram it is the vertical line through A.
Schedule: price 100 → 110 or 150, supply remains 100 units.
Examples are the number of seats in a cinema hall for one show, rare stamps and paintings, and land in a particular location. - Comparing the types at point A: all five curves pass through the same point A, but the flatter the curve, the more elastic the supply. Moving from the horizontal line (∞) through the flatter line (>1), the line through the origin (=1) and the steeper line (<1) to the vertical line (0), elasticity steadily falls.
- Role of time: in the very short period supply is nearly fixed (Es close to 0). In the short period it becomes relatively inelastic, and in the long period, when firms can expand plants and new firms can enter, it becomes relatively elastic.
- Measurement: Es is measured by the percentage method, (ΔQ / ΔP) × (P / Q), or by the arc method, which uses average prices and quantities. The arc method is preferred for large changes because it gives the same value in both directions.
Price elasticity of supply has five types, from perfectly elastic (∞) to perfectly inelastic (0). The flatter the supply curve, the more elastic the supply. In practice, most goods fall between these two extremes, and supply becomes more elastic as time passes.
Explore more questions
-
1.
Asked in 2083 (15 marks)
How do the tax policy, subsidy policy and price control policy of the government affect the market equilibrium?
(सरकारको कर नीति, अनुदान नीति र मूल्य नियन्त्रण नीतिले बजार सन्तुलनलाई कसरी प्रभाव पार्दछन् ।)
-
2.
Asked in 2083 (15 marks)
Critically analyze the Marginal Productivity Theory of Wages.
(ज्यालाको सीमान्त उत्पादकत्वको सिद्धान्तको आलोचनात्मक विश्लेषण गर्नुहोस् ।)
-
3.
Long question Asked in 2083 (15 marks)
Complete the following schedule if the market demand function is D = 1000 - 10P and the market supply function is S = 100 + 20P. (4+3+4+4).
(यदि बजार मागफलन D = 1000 - 10P छ र बजार पूर्ति फलन S = 100 + 20P छ भने, दिइएको सूची पूरा गर्नुहोस्।)
Price Market demand Market supply Shortage/ Surplus Pressure in price 10 20 30 40 50 a) Plot the market demand curve and the market supply curve in a figure. Show the equilibrium price and quantity both in schedule and figure.
(एउटा चित्रमा बजार मागवक्र र बजार पूर्तिवक्र खिच्नुहोस् । सूची र चित्र दुवैमा सन्तुलन मूल्य र परिमाण देखाउनुहोस् ।)
b) Calculate price elasticity of demand
(i) when price increases from 10 to 20 and,
(ii) when price decreases from 20 to 10.
(मागको मूल्यलोच गणना गर्नुहोस् (अ) जब मूल्य रु. १० बाट बढेर रु. २० हुन्छ र (आ) जब मूल्य रु. २० बाट घटेर रु. १० हुन्छ ।)
c) Calculate price elasticity of supply
(i) when price increases from 10 to 20 and,
(ii) when price decreases from 20 to 10.
(पूर्ति लोच गणना गर्नुहोस्
(अ) जब मूल्य रु. १० बाट बढेर रु. २० हुन्छ र,
(आ) जब मूल्य रु. २० बाट घटेर रु. १० हुन्छ ।)
-
4.
Long question Asked in 2083 (10 marks)
Complete the following table and explain the relation between average cost and marginal cost.
(दिइएको तालिका पूरा गर्नुहोस् तथा औसत लागत र सिमान्त लागत बिचको सम्बन्ध व्याख्या गर्नुहोस् ।)
Output TFC TC TVC AVC AC MC 0 24 24 - - - - 1 - 30 - - - - 2 - 32 - - - - 3 - 36 - - - - 4 - 48 - - - - 5 - 74 - - - - 6 - 120 - - - - -
5.
Long question Asked in 2083 (10 marks)
Consider the following two production preference schedules of a producer:
(उत्पादकका निम्न दूईवटा उत्पादन प्राथमिकता सूचीहरुमा ध्यान दिनुहोस् :)
Schedule 1 Schedule 2 Combination K L Output Combinations K L Output A1 10 60 1000 A2 10 75 1500 B1 20 25 1000 B2 20 40 1500 C1 30 10 1000 C2 30 25 1500 D1 40 5 1000 D2 40 15 1500 a. Compute total cost for each combination of capital and labor if price of use of capital is Rs.10, price of labor is Rs.5 and the producer has total cost outlay Rs.400 and identify the least cost combination.
(यदि पूँजीको प्रयोगको मूल्य रु. १० श्रमको मूल्य रु. ५ छ र उत्पादकसँग कूल लागत खर्च रु. ४०० छ भने पूँजी र श्रमको हरेक संयोगको कूल लागत गणना गर्नुहोस् र न्यूनतम लागत संयोग पत्ता लगाउनुहोस्।)
b. Sketch the isoquants \( \text{IQ}_1 and \text{IQ}_2 \) by using schedule 1 and schedule 2 respectively and sketch the isocost line also. Identify the optimal combination of capital and labor in figure.
(सूचि १ र सूचि २ प्रयोग गरेर सम उत्पादन रेखाहरू क्रमशः \( \text{IQ}_1 र \text{IQ}_2 \) खिच्नुहोस् तथा सम लागत रेखा समेत खिच्नुहोस् । चित्रमा पूँजी र श्रमको अधिकतम संयोग पत्ता लगाउनुहोस् ।)
-
6.
Asked in 2083 (10 marks)
How does a monopoly firm determine price in short run? Explain.
(अल्पकालमा एउटा एकाधिकार फर्मले मूल्य निर्धारण कसरी गर्दछ ? व्याख्या गर्नुहोस् ।)
Question
Open in new tabCouldn't load this question. Open it instead.